(Some of my hintervision thoughts are posted elsewhere. Here is an article from our Cloud Engagement Hub publication on Medium)
Last time we walked through the ingredients to add auto-scaling to your containerized applications, and provided a best practice to size your pods, and set resource request and limits. This time we will step through what changes were made to Stock Trader in order to have it automatically scale based on CPU utilization along with liveness and readiness probes.
As a refresher, Stock Trader is our microservices-based application that is freely available on github:
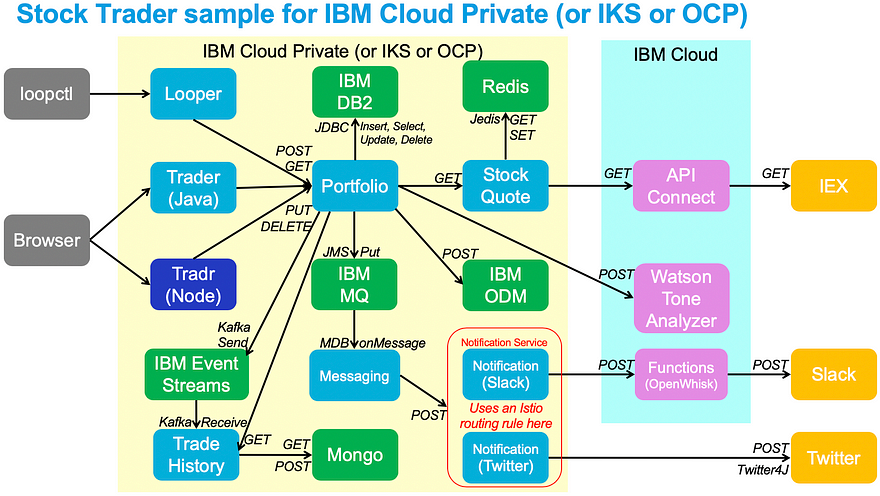
Step 1: Add Readiness and Liveness Probes (see in github)
The readiness and liveness probes we added started with a very basic URL that said “this liberty runtime is up”.
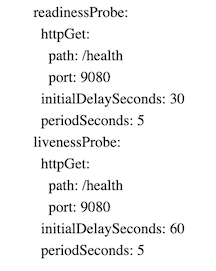
Over time, we added custom probes that were unique for each microservice. As mentioned above, the “Portfolio” microservice was “ready” only when it could connect to its data source. The “Stock-Quote” microservice, however, was only ready when it could connect to the stock quote API provided by API-Connect.
NOTE: as you develop your liveness probe, make sure you have resource limits and a low auto-scale maximum set. In our initial testing, the liveness probe would always fail, which resulted in an immediate restart. However, the HPA declared “I need at least 2 running at average 50% CPU utilization”, and since the startup of a pod took more than 50% CPU, in a very short period of time after we deployed portfolio, we ramped up from 2 pods to 10. It could have easily scaled to 100’s if we had set the maximum that high. Therefore, during these initial stages, we suggest you declare your resource limits, and auto-scale to a small maximum (10, for example).
Step 2: Add Resource Requests/Limits
As suggested in the best-practice, if you have a Liberty-based microservice, use the following resources as a starting point:
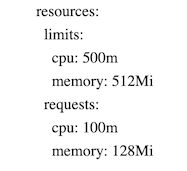
However, as soon as you can, run your microservice with a decent load (simulated if needed) so that you can start graphing your microservice. We used the “ICP Namespace Performance IBM Provided 2.5” Grafana dashboard. This gave us the cleanest example of how our pods ran. If you are using Microclimate, you could also open its “App Monitoring” view and add load onto your Java application.
In this image, we are showing the Stock Trader microservices and we were able to monitor CPU and memory usage in our initial tests:
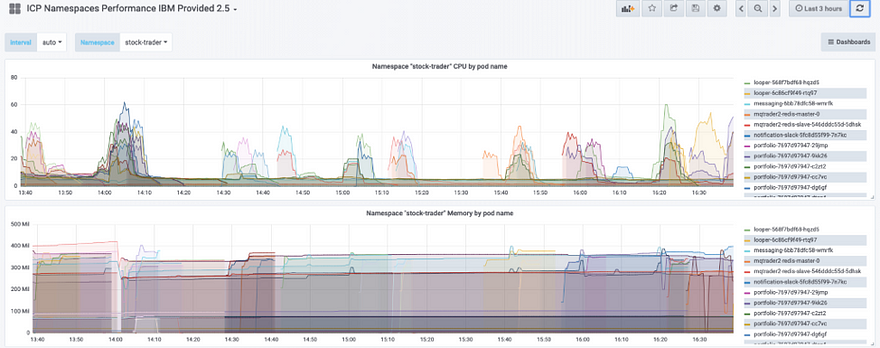
Once you verify the range of your microservice CPU and memory usage, refine the resource requests and limits.
A couple last notes on resource request/limits:
- These resource values are not only critical for auto-scale, they’re also used in basic Kubernetes scheduling. This means that if you specify values that are too high, Kubernetes may not find a worker node with enough resource. We found many times cases where ICP catalog content was sized too high and we could run in development just fine with much less CPU and memory.
- Early in development, you may not specify resource requests/limits. For us, this was so that we could have one pod to debug and view logs through. Kubernetes dynamically altered resources for that single pod as long as there was resource available in the compute node. However, we found quickly that as soon as we added resource limits, the pod, during initial testing, could hit resource limits quickly. In summary, as soon as you add resource limits, you will want to create your auto-scale policy to handle additional resource needs.
Step 3: Create Auto-scale policies
When first starting out, we recommend creating your first autoscale policy through the CLI. The following example is creating an HPA called “portfolio” to attach to the deployment called portfolio, and manage the number of pods between 2 and 10, based on average CPU % utilization across all “ready” pods so that the average stays around 50%.
kubectl autoscale deployment portfolio -n stock-trader — cpu-percent=50 — min=2 — max=10
To monitor the hpa, run the following to get the table below:
kubectl get hpa -n stock-trader

Notice in the above output that the “portfolio” HPA requires at least 2 pods to be running and will alter so that the real average CPU % is roughly equal to the target average CPU %. In this case notice that since we do not have any load on the pods, CPU % is only 8%. But since the minimum number of pods is 2, it cannot scale down any further. Once further testing is done, then we added the HPA into the yaml file. Now, every time the “portfolio” microservice is deployed, the associated HPA will also be created.
Step 4: Edit Auto-scale policies
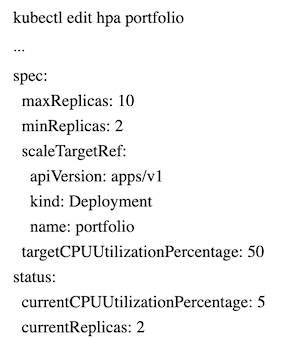
Initially, when we created the HPAs through kubectl, editing was quite messy. As a result, even the docs suggested to delete and recreate the policies. This was simple kubectl delete hpa portfolio. However, we found that after we created the autoscales policies through the deploy.yaml file, editing the HPA through kubectl was easy:
Step 5: Add Load and Measure Usage/Scaling
For our Stock Trader microservices we ran a tool we created called “Looper” ( view here). This ran our pods (except the UI) with repeated load. Then, to exercise the UI, we ran a test container:
kubectl run -i — tty load-generator — image=busybox /bin/sh
Then ran:
while true; do wget -q -O- https://9.42.19.205/trader; done
With this load across all microservices, we can now look at the results via the CLI. Viewing realtime HPA details here shows that utilization is too high so the HPA is actively provisioning additional pods:

Later on, we see they are more balanced:

Finally, after we stop the load across all pods, the cool-down period of 5–7 minutes results in scaling back to the minimum:

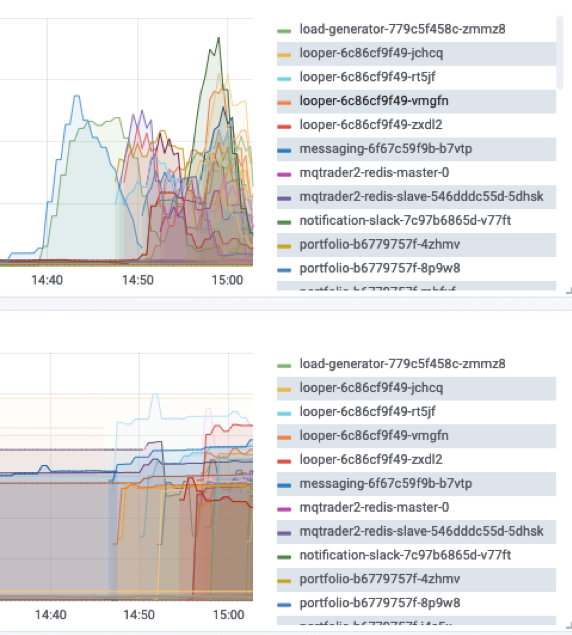
Notice in this Grafana dashboard it shows not only the Stock Trader pods but the looper and load generator pods.
Step 6: Validate Stability
Once your microservices-based app is autoscaling properly, now is the time to run ‘creative tests’, chaos monkey-style tests, to see how it responds to outages and additional load. Here are some examples to try based on Stock Trader architecture:
- Add multiple load sources to simulate “Peak usage”
In our case, we needed “Looper” and our UI load generator to generate normal steady-state usage. For additional “peak usage” load, set up a second “looper” running from a different source so that you can hit your application with bursts of activity in addition to the regular load. - Kill pods
Go into the UI or kubectl CLI and just start deleting pods. This will test a real-world scenario where a pod dies and needs to be rescheduled. You could also go into the deployment object and scale up/down manually to see how the HPA reacts. - Taint worker nodes
To simulate pulling the plug on a VM, add a taint to a worker node that prohibits scheduling and execution. This will remove all pods from the VM and schedule them on other worker nodes. In some cases, you won’t have enough resource to auto-scale properly so you can see how your app works in distress. - Remove middleware (Redis)
To simulate a problem with middleware you depend on (Redis, for example), you can scale down to zero the redis deployment. This will then let you validate your code can handle the outage. - Define new data source (test liveness)
Test the liveness check in your pods. If you recall, our “Portfolio” pod said that if it gets three concurrent errors in calling the data source it is no longer “live”. To test this, create a second data source, edit the secret for “portfolio”, and scale down the existing data source (no need to delete … you will be testing this again). You will see the existing portfolio pods get removed after 3 failed attempts at the now-dead data source and when the new pods start, it will pick up the secret with the new (and running) data source and soon enough your app will be alive and kicking.
Step 7: Consider Istio Optimization
For those using Istio for your microservices mesh, the main consideration is the resource requests and limits. During your initial testing with Istio, increase the resource limits for your microservices by 100m CPU and 128Mi Memory so that when the Istio sidecar container is added, your pod will still auto-scale appropriately.
Auto-Scaling using Custom Metrics
If you have custom application-level metrics you want to use in your auto-scaling you can do that by following this documentation. In summary, you will need to install a Prometheus adapter into IBM Cloud Private and then follow the instructions to configure your .yaml files.
OK! Thanks for reading and keep learning! Have questions? I encourage you to post comments below and engage in our conversation.

8nbugd
flm35h